Few things spark debate like a season-long predictions table. To keep the conversation anchored in numbers rather than hunches, we ran a full-season simulation and stacked its results against the betting market’s pre-season title prices.
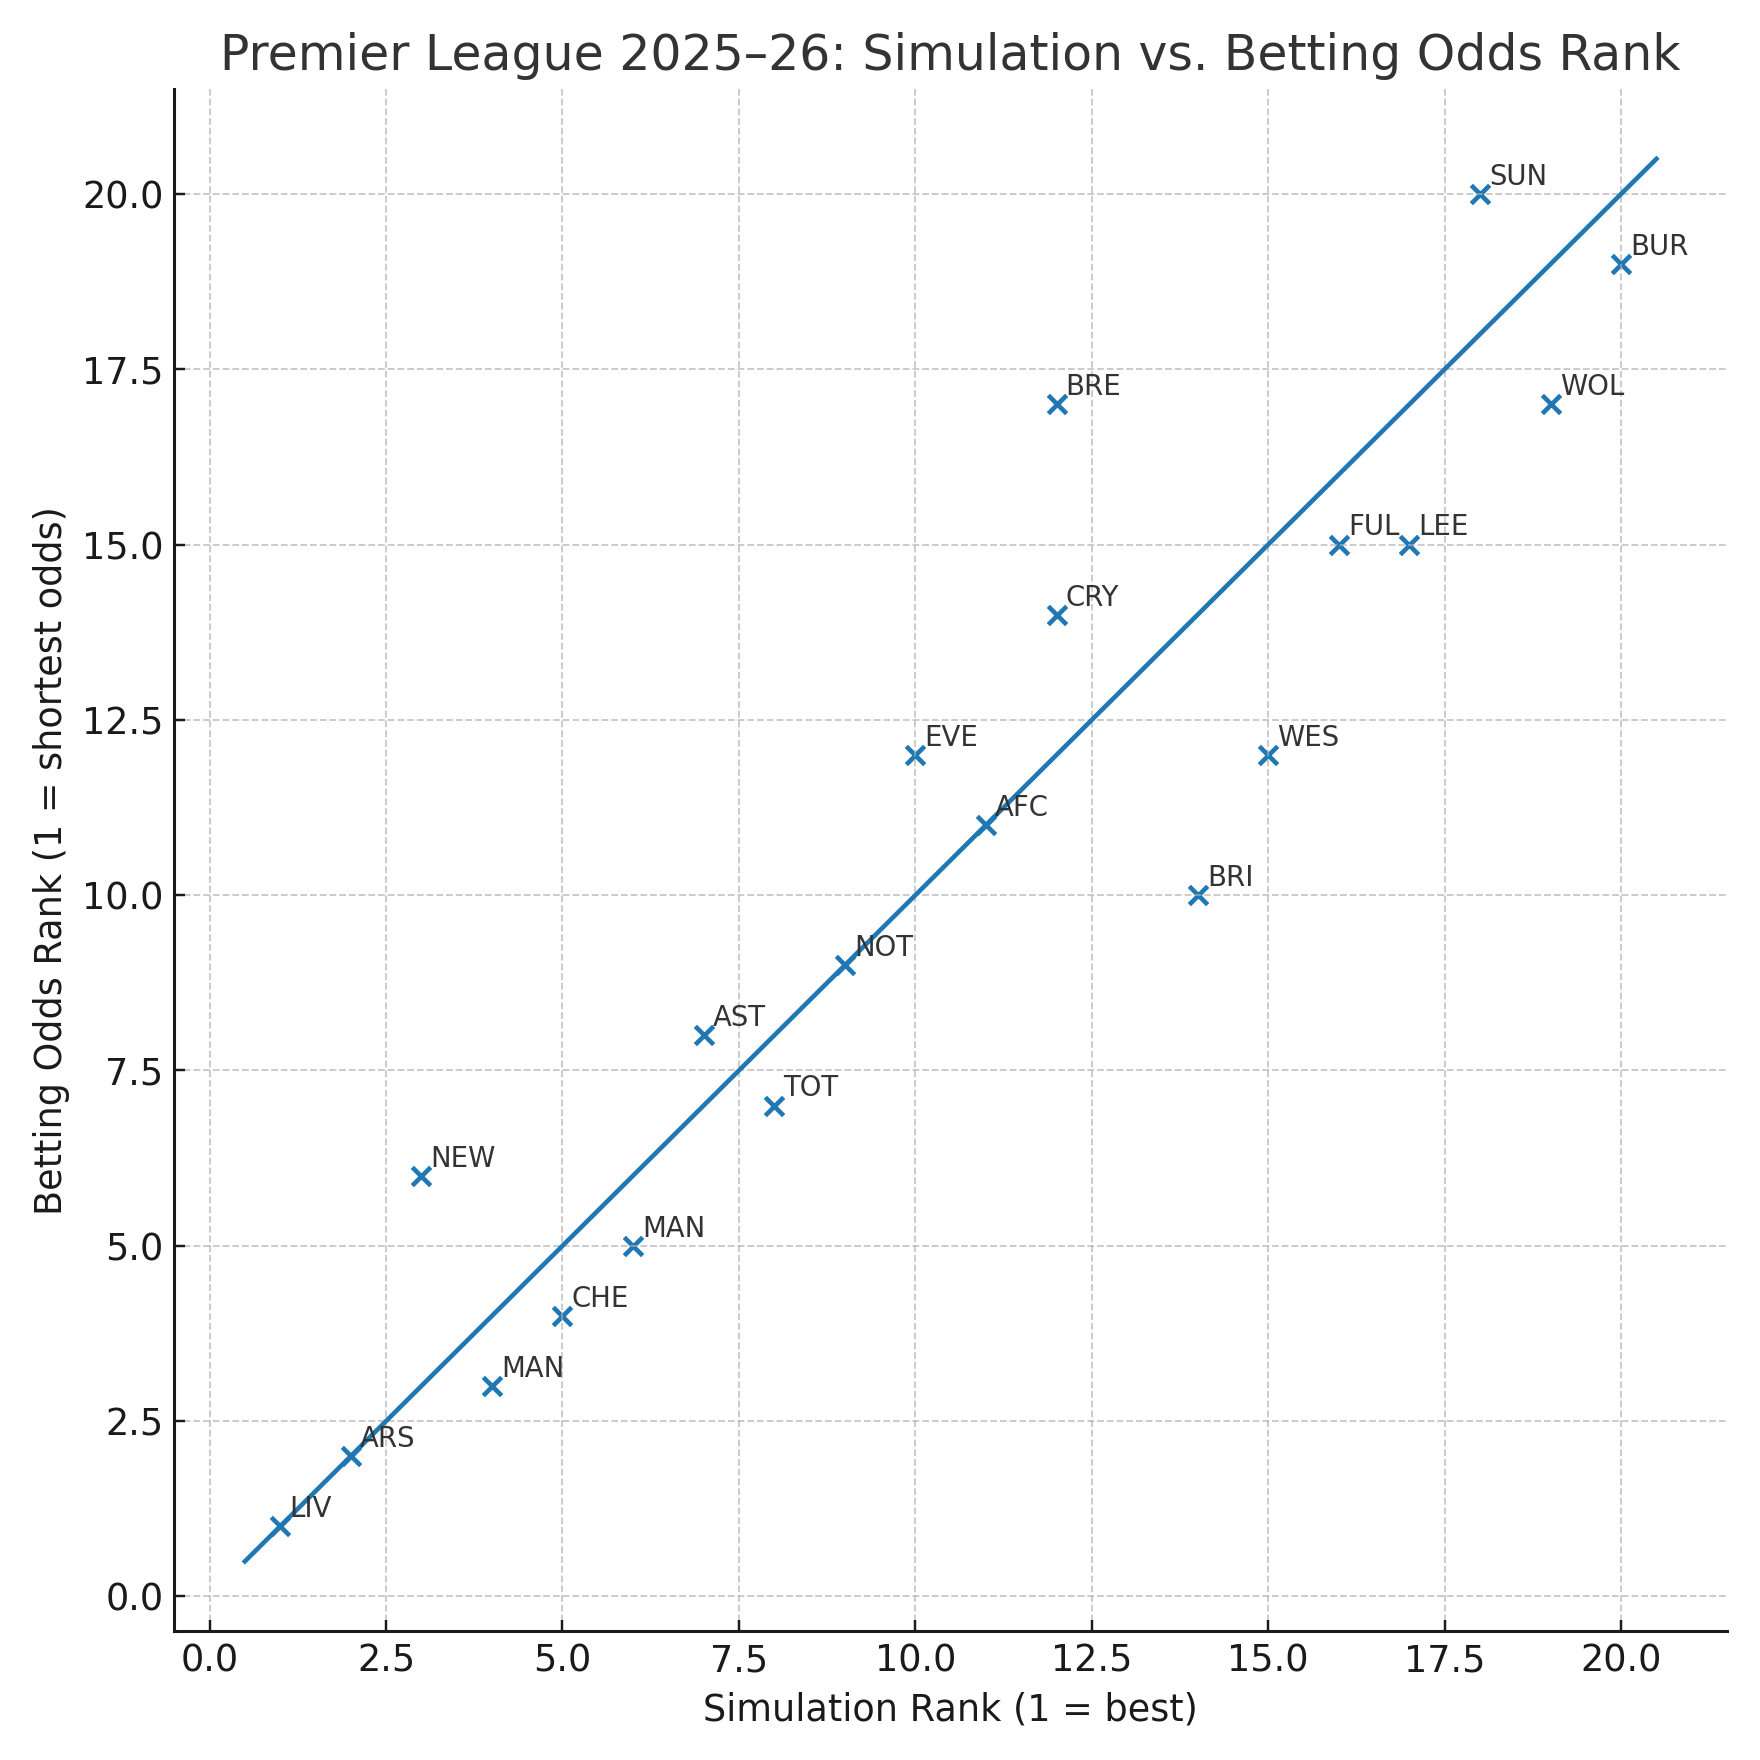
The simulation ranks teams by projected points, while the betting side is converted to an “odds rank” (1 = shortest title odds). This lets us see where week-to-week consistency (points) lines up with perceived title ceiling (odds), and—more importantly—where it doesn’t.
The agreement is strikingly high overall. Using the 20 teams in the file, the correlation between simulation rank and odds rank is 0.94, with an average absolute difference of just 1.6 places. That means the market and model see the league through a very similar lens.
Yet the few gaps that remain tell the best stories: a Champions League interloper, mid-table re-ratings, and a relegation fight that doesn’t quite match the price screen.
At the top, the model sketches a familiar skyline. Liverpool lead the table on 87 projected points, followed by Arsenal on 80. That matches the odds board, which also has Liverpool and Arsenal as the two shortest prices. The key nuance is how the next two places fall. The simulation sides with Newcastle for third on 71 points, nudging Manchester City to fourth on 70.
The market, however, continues to price City as the third-most likely champions, with Newcastle a step behind in sixth. This is a classic ceiling-versus-floor dynamic. Title odds tilt toward who can hit the very top of the distribution; a points model rewards the steadier drumbeat of results. You could read this as the simulation trusting Newcastle’s accumulation—dominant against the bottom half, robust at home—while the market still believes City’s peak is too high to ignore over 38 games.
The Champions League race forms a neat shelf. After City in fourth, Chelsea are next on 65 points, then Manchester United on 62 and Aston Villa on 59. The separation is important: there’s a five-point drop from fourth to fifth and another five from seventh to eighth.
Tottenham land on the wrong side of that second gap with 54 points, exactly where the odds have them—just outside the comfort zone of the Big Seven. This isn’t a dismissal of Spurs as much as a marker of how tall the Champions League ladder is this season; you’ll likely need to exceed 60 to climb it. For those tracking finishing position markets, this points-based tiering is a useful counterweight to brand-driven optimism.
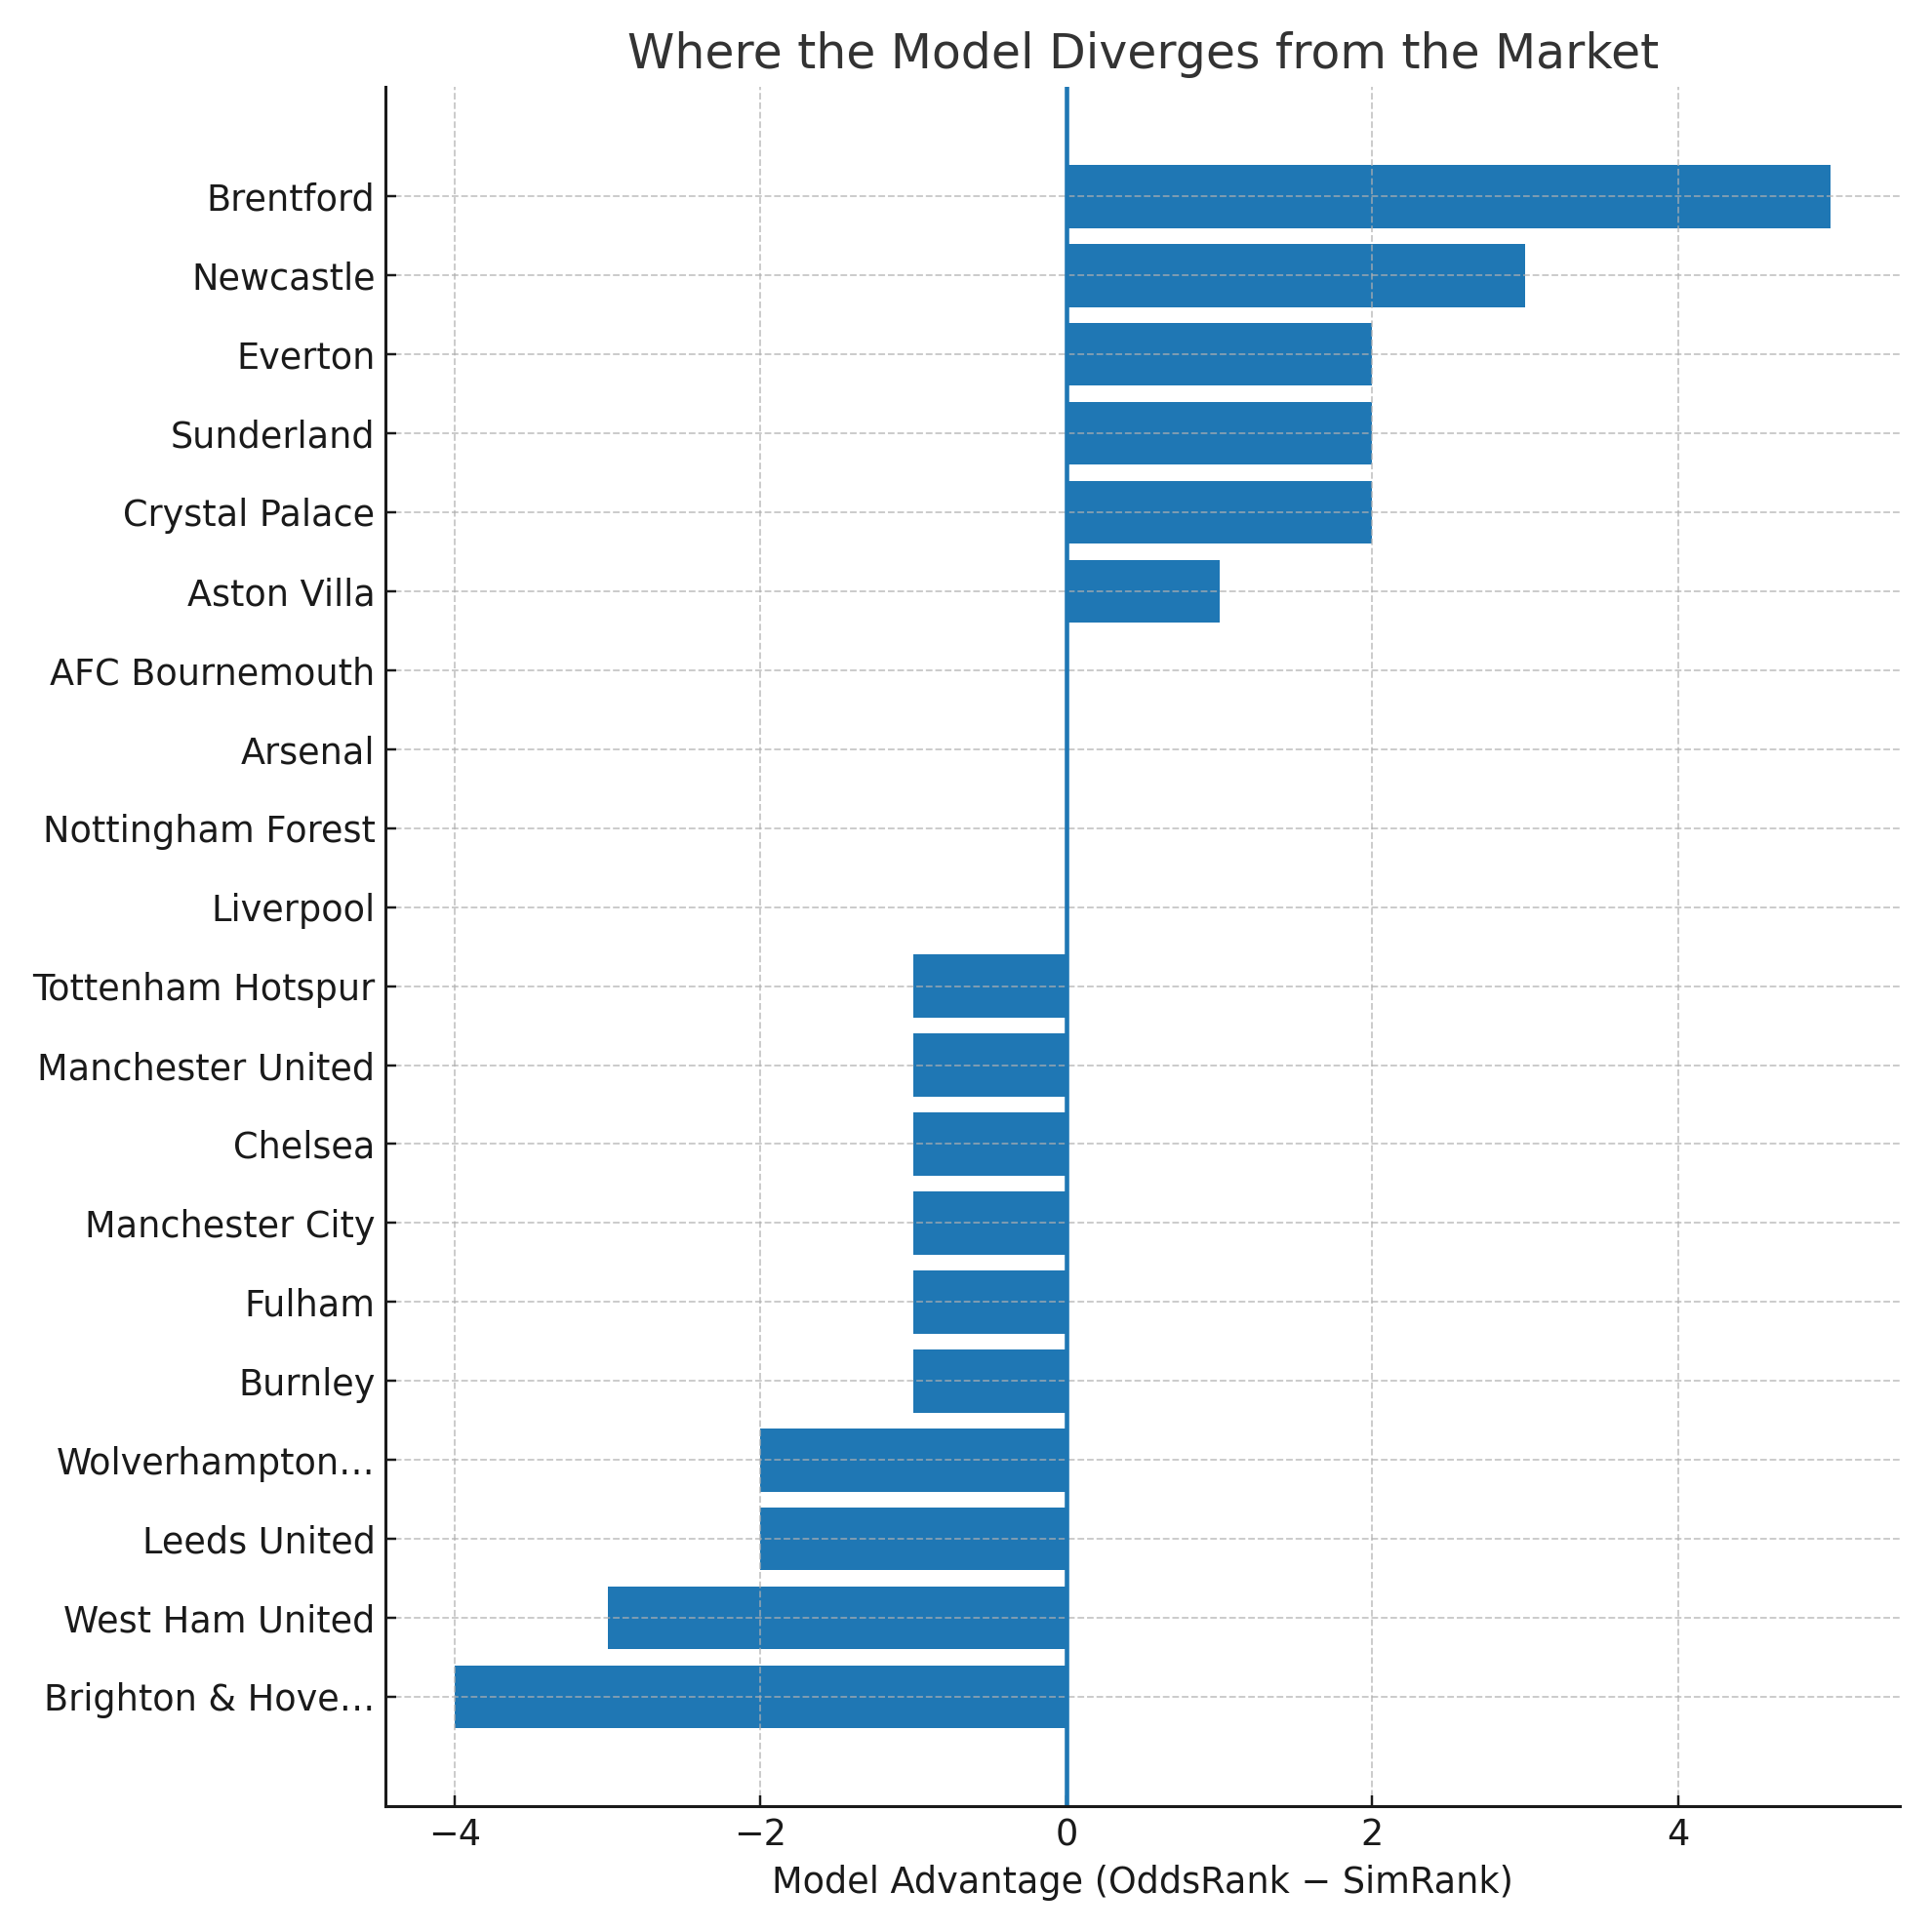
Mid-table is where the model pushes back most clearly against the consensus. Brentford are the headline: the simulation puts them 12th on 49 points, while the outright prices rate them just 17th for the title, a five-place model advantage.
That doesn’t mean Brentford are suddenly a top-eight threat; it does mean the model sees comfortable safety, a club more likely to hover near the middle than flirt with the trapdoor.
Everton enjoy a smaller but still notable upgrade, slotted 10th by the model versus 12th by odds. Nottingham Forest and Bournemouth, interestingly, are perfect matches between methods—9th and 11th respectively—suggesting the market has a clean read on both. Crystal Palace tie with Brentford on points and come out 12th on the simulation’s ordering as well.
On the other side of the ledger, Brighton and West Ham are priced more kindly by the market than by the model. Brighton’s title odds imply a top-ten profile, but the simulation brings them back to 14th on 47 points.
West Ham show a similar pattern: 12th in odds, 15th by projected points. Neither reading screams crisis; instead, they hint at risk. If the mid-table compresses—and it usually does—those few points shaved by the model can be the difference between finishing 10th with comfort or scrapping from 12th to 15th with thin margins.
The relegation picture carries two clear messages. First, it’s not a single tier. Leeds are pencilled in for 38 points in 17th, with Sunderland on 35 in 18th—close enough that the final weekends will matter. Then there’s a sharp step down: Wolves at 28 and Burnley at 13. The model is less pessimistic on Sunderland than the market, which prices them as the league’s longest shot; that two-place model advantage suggests survival is within reach if they run hot in the six-pointers.
Wolves, conversely, look more vulnerable to a bad year than their odds imply. Burnley anchor the table in both views, and it would take more than just variance to hoist them out of danger. Fulham’s 42 points and West Ham’s 46 form a buffer above the line, but the gradient is steep enough that a cold run could pull either into a springtime scrap.
Why do these gaps exist if the ranks agree so strongly overall? Part of it is what each metric actually measures. Title odds are a proxy for ultimate upside: how often a team can thread the needle and finish first. Points simulations reward repetition: how reliably a team harvests results across 38 fixtures, including bridge-weeks and awkward awaydays.
Newcastle are the best example of that difference—a high-floor, accumulation-friendly team boosted by the model but not yet an oddsboard darling. Brentford are the mid-table mirror: priced for drift, projected for stability. And Brighton and West Ham remind us that attacking identities and past peaks can buoy odds longer than a points model is willing to indulge.
The bottom line for 2025–26 is that the title remains a two-team gravity well with a third force not far off, the Champions League cutoff sits around the low 60s, and mid-table reality may be kinder to Brentford and Everton than the odds suggest. If you’re a believer in finishing position or points totals, the model’s small edges are exactly where value usually hides. If you prefer outright markets, the lack of major rank disagreements should reassure you that the underlying order of the league is well understood—just not perfectly so, and never everywhere at once.
Check Accuscore's English Premier League expert picks and full match analysis at EPL Predictions page and SIGN UP for a free 7-day trial to gain full access!


