Understanding AccuScore’s Football Picks
Need help understanding AccuScore's football picks? AccuScore may look a bit different because we've updated our look to make things easier for our members. It's still the same great simulations and layout, but now, it's easier to read than ever.
There are two views: The Graph View and the Grid View (better for college football).
The Graph View: UPDATED
After updating our graph view, spread and totals picks are clearer to see than ever before.
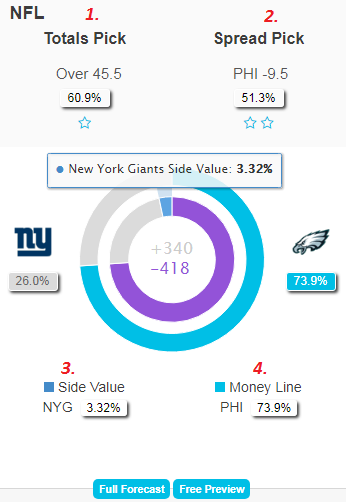
For each pick above, we have assigned a number to help explain how to read each of AccuScore's expert picks for every game: Totals, Spreads, Side Value and Moneyline:
1. The Totals pick in this example is "OVER 45.5 points" and 60.9% of simulations have resulted in the games going OVER. This is listed as a one star trends pick (out of 4 stars).
2. The spread pick in this example is "PHI -9.5" because Philadelphia covered the 9.5 points spread in 51.3% of simulations. This pick is identified as a 2-star trends pick, which serves as a good example to remind you that the trends rating is not based on the computer's probability but on the historical trends of how the computer has performed with the teams and other historical trends.
3.The side value pick was the New York Giants, because the moneyline odds at +340 offered 3.4% value when converting Vegas odds into a percentage. This is also represented by the inside circle in the graph. The Vegas odds were giving the Giants a 22.8% chance to win, while AccuScore calculated that the Giants had a 26% chance to win. This means there is 3.2% side value on picking the Giants at +340.
4.The moneyline pick is pretty straight forward in that AccuScore's simulations resulted in the Philadelphia Eagles winning 73.9% of the time in this example. If there is any team that is more than 50% to win, it is the moneyline pick.
If you click on the “full forecast” box, you can play around with slider tools that allow you to adjust the spreads and totals lines to see AccuScore's probabilities at various other lines. Also, the full forecast has player projections for both teams.
Grid View
To get to the grid view, take a look at the red arrow above and click on the three lines. The graph symbol allows you to switch back to the graph view. Due to the number of games in College Football, the grid view is now the default view. Also, you can type in team abbreviations in the search box (green arrow) and find any game you’re looking for faster. The graph view is the default view for most other sports, but switching to the grid view is the same process for every sport.
Understanding the Grid View

Let’s use an example from a college football game to illustrate the grid view: LATech vs Arkansas
Let’s go column by column to understand what everything means in the grid view. Acc Sim% simply lists AccuScore’s simulation calculations, which list Arkansas as an 88% favorite. Conversely, Louisiana Tech only won 11% of simulations. That’s easy enough.
Odds% is AccuScore converting the public odds into a percentage. Before you freak out and think something is wrong, the percentage is over 100% because bookies add a bit of juice to their end. While we removed that juice in the past and converted odds to be out of 100%, leaving the juice in actually allows for a clearer look at true side value because it doesn’t arbitrarily push down Vegas’ odds as a percentage.
In this case, Vegas oddsmakers are saying there is a 97.22% chance of Arkansas winning and only a 5.69% chance of LATech winning. Looking at it side-by-side with AccuScore’s Sim%, the side value is clearly on LATech.
The next column is “PS” and “ACC PS.” The top number is the point spread set by bookmakers, which is Arkansas -25. Below it, AccuScore lists the point spread line we believe it should be: Arkansas -21. Since Vegas is overinflating Arkansas, the point spread pick is Louisiana Tech.
Next, we have the “OU” and “Acc OU” column. Similar to the last column, the first number (52) is the Over/Under line set by Vegas oddsmakers. The number below it is the Over/Under line AccuScore calculated. Since AccuScore’s line is higher than the public odds, the pick is the OVER.
The final three columns are ML, SV, and Total, and all of them simply list the star-rated picks. As the season continues, we will have more trends and 3 and 4-star picks. Using the arrows, members can sort games by star-ratings and instantly find all games offering 4-star totals picks.
Note: AccuScore still offers the ability to change lines and change spreads by clicking on the team names in the grid view. Also, you can see written previews for every game, top trends and player projections.