Understanding AccuScore’s NBA and College Basketball Expert Picks
Need help understanding AccuScore's basketball picks? AccuScore may look a bit different because we've updated our look to make things easier for our members. It's still the same great simulations and layout, but now, it's easier to read than ever.
There are two views: The Graph View and the Grid View (better for college basketball).
The Graph View: Updated
After updating our graph view, spread and totals picks are more clearly labeled than ever before.
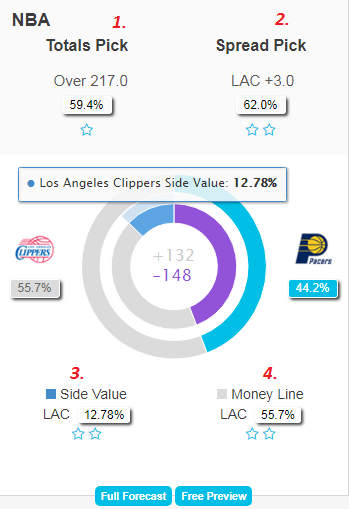
For each pick above, we have assigned a number to help explain how to read each of AccuScore's expert picks for every game: Totals, Spreads, Side Value and Moneyline:
1. The Totals in this example is Over 217.0 point, meaning that more of AccuScore's simulations went over than under the 217.0 total points line. The 59.4% listed below the "OVER 217.0" refers to the percentage of simulations that went over the 217.0 point when AccuScore played the game out 10,000 times. Below that, the pick is identified as a one star pick, meaning the trends involving totals picks with these two teams, along with other trends based on lines and sport-wide, are not strong.
2. The spread pick in this example is LAC+3. The LA Clippers were three-point underdogs in this example, and AccuScore's simulations had the Clippers losing by fewer than three points or winning outright in 62% of simulations. This is listed as a two star trends pick.
3. The Clippers were moneyline underdogs in Vegas in this game. AccuScore had them winning 55.7% of simulations, while Vegas had them only winning 42.9% of the time. As such, there is value on picking the Clippers on the moneyline at +132. More definitively, there is 12.78% Side Value on picking the Clippers to win on the moneyline. This is identified as a 2-star trends pick.
4. The moneyline pick is pretty straight forward in that AccuScore's simulations resulted in the Clippers winning 55.7% of the the time. If there is any team that is more than 50% to win, it is the moneyline pick. That isn't to do with any value, but it's the most likely result according to AccuScore's simulations.
If you click on the “full forecast” box, you can play around with slider tools that allow you to adjust the spreads and totals lines to see AccuScore's probabilities at various other lines. Also, the full forecast has player projections for both teams.
Grid View
To get to the grid view, take a look at the red arrow above and click on the three lines. The graph symbol allows you to switch back to the graph view. Due to the number of games in College Basketball, the grid view is the default view for that sport. Also, you can type in team abbreviations in the search box (green arrow) and find any game you’re looking for faster. The graph view is the default view for most other sports, but switching to the grid view is the same process for every sport.
Understanding the Grid View

Let’s use an example from another NBA game to illustrate the grid view: Washington vs Charlotte
Let’s go column by column to understand what everything means in the grid view. Acc Sim% simply lists AccuScore’s simulation calculations, which lists Washington as an 39.5% underdog. Conversely, Charlotte is 60.3% favorite, according to AccuScore's simulations. That’s easy enough.
Odds% is AccuScore converting the public odds into a percentage. Before you get worried and think something is wrong, the percentage is over 100% because bookies add a bit of juice to their end. While we removed that juice in the past and converted odds to be out of 100%, leaving the Vig in actually allows for a clearer look at true side value because it doesn’t arbitrarily push down Vegas’ odds as a percentage.
In this case, Vegas oddsmakers are saying there is a 54.13% chance of Washington winning and a 48.31% chance of Charlotte winning. Looking at it side-by-side with AccuScore’s Sim%, the side value is clearly on Charlotte. AccuScore has Charlotte as a favorite, while Vegas has Charlotte as an underdog.
The next column is “PS” shows AccuScore's point spread pick at Charlotte +1.5, which makes sense considering AccuScore has Charlotte as the moneyline favorite.
Next, we have the “OU” and “Acc OU” column. The first number (231.5) is the Over/Under line set by Vegas oddsmakers. The number below it is the Over/Under line AccuScore calculated (238). In this example, AccuScore's totals line is higher than Vegas' totals line, so AccuScore's pick is the Over 231.5.
The final three columns are ML, SV, and Total, and all of them simply list the star-rated picks. These star ratings are indicative of previous team, sports and lines trends related to the game.
Note: AccuScore still offers the ability to change lines and change spreads by clicking on the team names in the grid view. Also, you can see written previews for every game, top trends and player projections.


