Understanding AccuScore’s New Football Simulations
Been away for a while? AccuScore may looks a bit different. Take a deep breath. The simulations haven’t changed, but the look has. So, we’re going to walk you through how to find your football picks and also how to read the new simulations.
There are two views: The Graph View and the Grid View.
The Graph View
Side Value and Moneyline
As this was a pretty big change, it took us a moment to get everything into the graph view, but now we have it. Let’s take a look at an example from NCAA Football below.
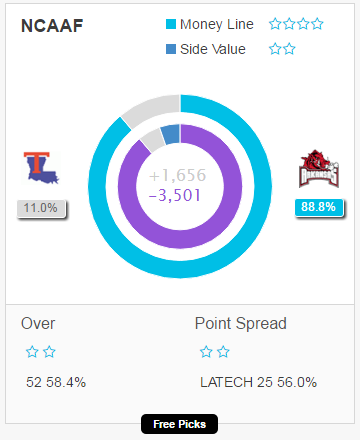
In the example above, there is a 4-star moneyline pick and 2-star side value pick. The Moneyline pick is clearly Arkansas, represented by the outside circle. Also, the 88.8% of simulations resulted in Arkansas winning, which written below the team’s symbol. This is the moneyline pick. AccuScore’s simulations are represented by the outside circle.
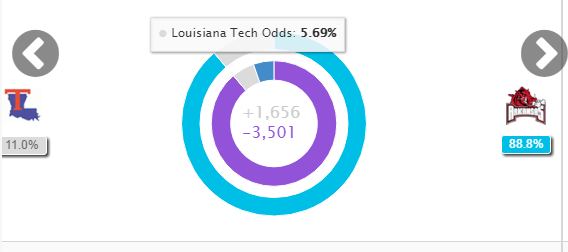
The side value, however, is represented by the inside circle, and as you can see in the image above, the odds only give Louisiana Tech a 5.69% chance of winning versus AccuScore giving Louisiana Tech an 11% chance of winning, so there is side value on picking the underdog here.
Over/Under and Point Spread Picks
In the illustration below, you’ll find a green arrow and a red arrow. The green arrow is AccuScore’s Totals pick. In the example below, AccuScore is picking the Over in this game, which is a two-star pick. Below the stars, the “52” represents the line, so AccuScore is saying this game will go OVER 52. The 58.4% shows you what percentage of simulations went OVER 52. If you click on the “free picks” or “more info” box, you can play around with slider tools to adjust the lines if you’re getting a different line.
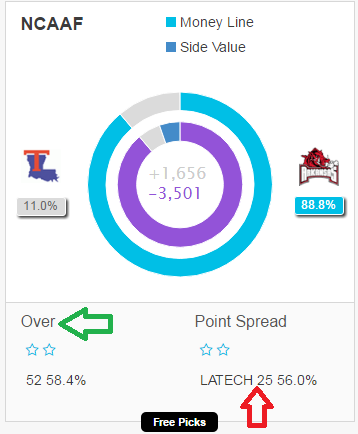
The red arrow shows AccuScore’s pick against the spread. In this game, the pick is LA Tech +25, which is a two-star pick. Again, the 56% represents the percentage of simulations that saw LA Tech losing by 25 or fewer points or winning outright.
Grid View
To get to the grid view, take a look at the red arrow above and click on the three lines. The graph symbol allows you to switch back to the graph view. Due to the number of games in College Football, the grid view is now the default view. Also, you can type in team abbreviations in the search box (green arrow) and find any game you’re looking for faster. The graph view is the default view for most other sports, but switching to the grid view is the same process for every sport.
Understanding the Grid View
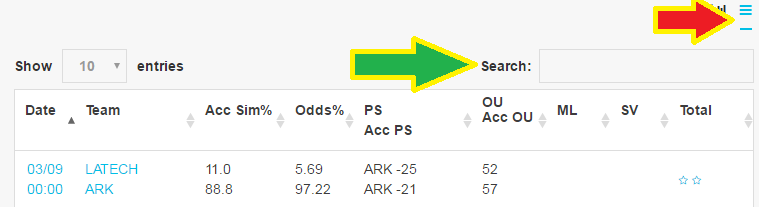
Let’s use the same example we’ve been using and the same game that’s listed in the above illustration of the grid view: LATech vs Arkansas
Let’s go column by column to understand what everything means in the grid view. Acc Sim% simply lists AccuScore’s simulation calculations, which list Arkansas as an 88% favorite. Conversely, Louisiana Tech only won 11% of simulations. That’s easy enough.
Odds% is AccuScore converting the public odds into a percentage. Before you freak out and think something is wrong, the percentage is over 100% because bookies add a bit of juice to their end. While we removed that juice in the past and converted odds to be out of 100%, leaving the juice in actually allows for a clearer look at true side value because it doesn’t arbitrarily push down Vegas’ odds as a percentage.
In this case, Vegas oddsmakers are saying there is a 97.22% chance of Arkansas winning and only a 5.69% chance of LATech winning. Looking at it side-by-side with AccuScore’s Sim%, the side value is clearly on LATech.
The next column is “PS” and “ACC PS.” The top number is the point spread set by bookmakers, which is Arkansas -25. Below it, AccuScore lists the point spread line we believe it should be: Arkansas -21. Since Vegas is overinflating Arkansas, the point spread pick is Louisiana Tech.
Next, we have the “OU” and “Acc OU” column. Similar to the last column, the first number (52) is the Over/Under line set by Vegas oddsmakers. The number below it is the Over/Under line AccuScore calculated. Since AccuScore’s line is higher than the public odds, the pick is the OVER.
The final three columns are ML, SV, and Total, and all of them simply list the star-rated picks. As the season continues, we will have more trends and 3 and 4-star picks. Using the arrows, members can sort games by star-ratings and instantly find all games offering 4-star totals picks.
Note: AccuScore still offers the ability to change lines and change spreads by clicking on the team names in the grid view. Also, you can see written previews for every game, top trends and player projections.